


In this experiment, the motion of the camera is identical to the range experiment.
However, the system works keeping track of the last estimated transformation and using it as initialization to the next step. Thus, we expect a bigger working range.
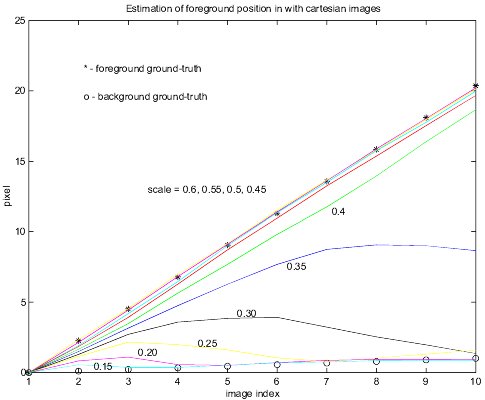
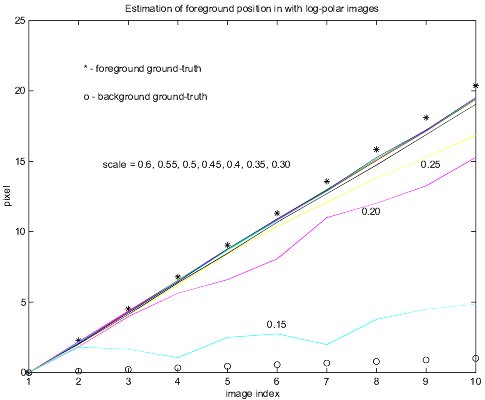
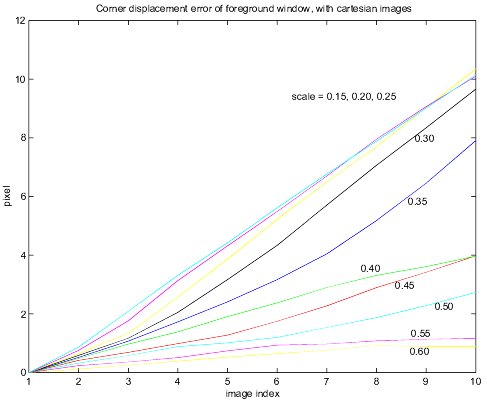
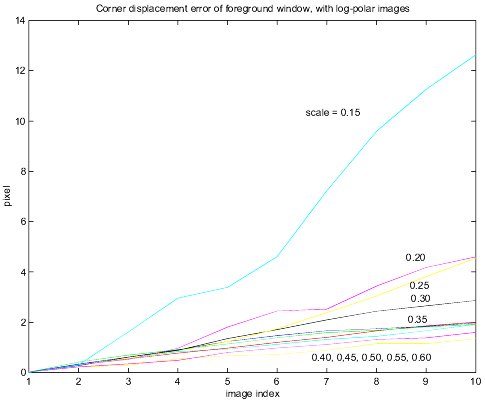
Again, we present plots of the estimated centroid of the object and the matching error.
| Cartesian | Log-Polar | |
| Centroid | cartcenter.jpg | logcenter.jpg |
| Matching Error | cartcorner.jpg | logcorner.jpg |
The following table summarizes some of these results. The break down is measured when error on the centroid or the matching error are bigger than 2 pixel.
| Range | Cartesian Break-Down (effective area scale) | Log-Polar Break-Down (effective area scale) |
| 1 step = 2.25 pixel | n.a. | n.a |
| 2 step = 4.50 pixel | 13.22% | 6.06% |
| 3 step = 6.75 pixel | 25.92% | 6.06% |
| 4 step = 9.00 pixel | 25.92% | 10.78% |
| 5 step = 11.25 pixel | 33.85% | 10.78% |
| 6 step = 13.50 pixel | 42.84% | 24.24% |
| 7 step = 15.75 pixel | 42.84% | 24.24% |
| 8 step = 18.00 pixel | 52.89% | 24.24% |
| 9 step = 20.25 pixel | 52.89% | 24.24% |
We also present images obtained by the system in situations (40% size and 30% size) where the cartesian version of the algorithm starts breaking down:
Scale = 40% size
| Cartesian | Log-Polar | |
| Estimated trajectory | |
|
| Last image | |
|
| Registered image | |
|
Scale = 30%
| Cartesian | Log-Polar | |
| Estimated trajectory |  |
 |
| Last image |  |
 |
| Registered image |  |
 |